In today's fast-paced world, businesses are constantly seeking ways to make informed decisions quickly. One of the most powerful tools in the Business Intelligence (BI) arsenal is Tableau. This blog post will explore the capabilities of Tableau for business intelligence, highlighting its role in transforming data into actionable insights.
Tableau is renowned for its ability to create stunning data visualizations and dashboards, making complex data easy to understand. It empowers data professionals, analysts, and business leaders to see and understand their data like never before. But what makes Tableau stand out in the crowded field of BI tools?
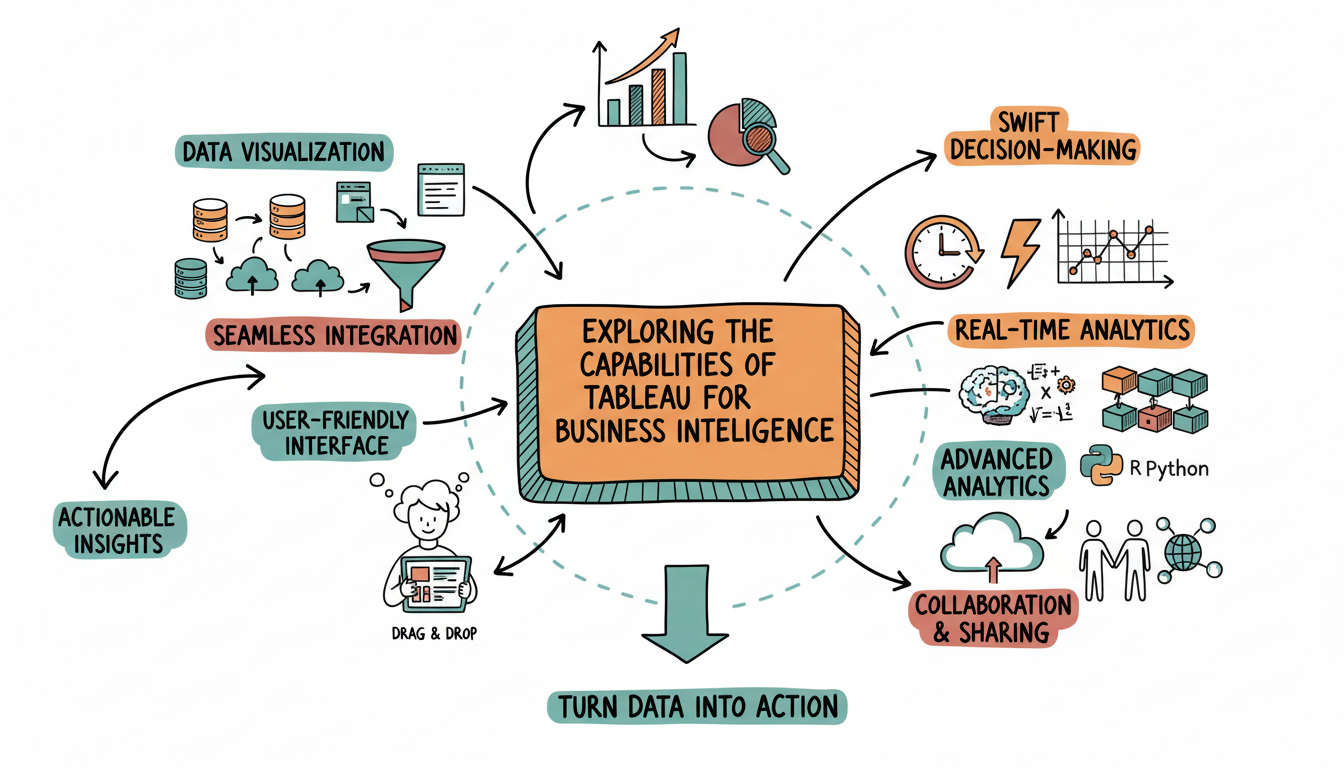
The Power of Visualization
Tableau excels in data visualization, a crucial aspect of business intelligence. By transforming raw data into visual formats, Tableau helps users identify trends, patterns, and outliers that might be missed in traditional spreadsheets. This capability is particularly beneficial for businesses that need to make quick, data-driven decisions. According to a study by Gartner, companies that use data visualization tools like Tableau are 28% more likely to find timely insights (source: Gartner).
User-Friendly Interface
One of Tableau's standout features is its user-friendly interface. Even those with limited technical skills can create complex visualizations with ease. This democratization of data analysis means that more people within an organization can contribute to data-driven decision-making. A report from Forrester highlights that Tableau's intuitive drag-and-drop functionality significantly reduces the learning curve for new users (source: Forrester).
Seamless Integration
Tableau integrates seamlessly with a wide range of data sources, from spreadsheets and databases to cloud services and big data platforms. This flexibility allows organizations to consolidate data from multiple sources into a single, coherent view. According to a survey by BARC, 64% of businesses reported improved data integration after implementing Tableau (source: BARC).
Real-Time Analytics
In the age of big data, real-time analytics is a game-changer. Tableau's ability to connect to live data sources means that businesses can access up-to-the-minute information, enabling them to respond swiftly to changing conditions. This capability is crucial for industries like finance and retail, where timely insights can lead to competitive advantages.
Advanced Analytics
For those seeking deeper insights, Tableau offers advanced analytics features. Users can perform complex calculations, create predictive models, and conduct statistical analyses without needing to write code. This functionality is supported by Tableau's integration with R and Python, allowing data scientists to leverage their existing skills within the Tableau environment.
Collaboration and Sharing
Tableau also fosters collaboration by making it easy to share insights across an organization. Dashboards and reports can be published to Tableau Server or Tableau Online, where they can be accessed by colleagues anywhere in the world. This capability ensures that everyone is working from the same data, reducing the risk of miscommunication and enhancing strategic alignment.
Conclusion
Tableau's capabilities make it a standout tool in the business intelligence landscape. Its powerful visualization features, user-friendly interface, seamless integration, real-time analytics, advanced analytics, and collaboration tools empower organizations to harness the full potential of their data. As businesses continue to navigate an increasingly data-driven world, tools like Tableau will be essential for staying ahead of the curve.
For data professionals, analysts, and business leaders, understanding and leveraging the capabilities of Tableau can lead to more informed decisions, greater efficiency, and a stronger competitive edge. As we continue to explore the possibilities of business intelligence, Tableau remains a vital tool for turning data into actionable insights.