In today's fast-paced business environment, creating interactive dashboards with DataLoyalty has become a game-changer for organizations looking to leverage data effectively. As businesses increasingly rely on data-driven decisions, the ability to visualize and interact with data in real-time is crucial. DataLoyalty, a leading business intelligence platform, offers powerful tools to create dynamic dashboards that provide valuable insights and drive strategic actions.
Why Interactive Dashboards Matter
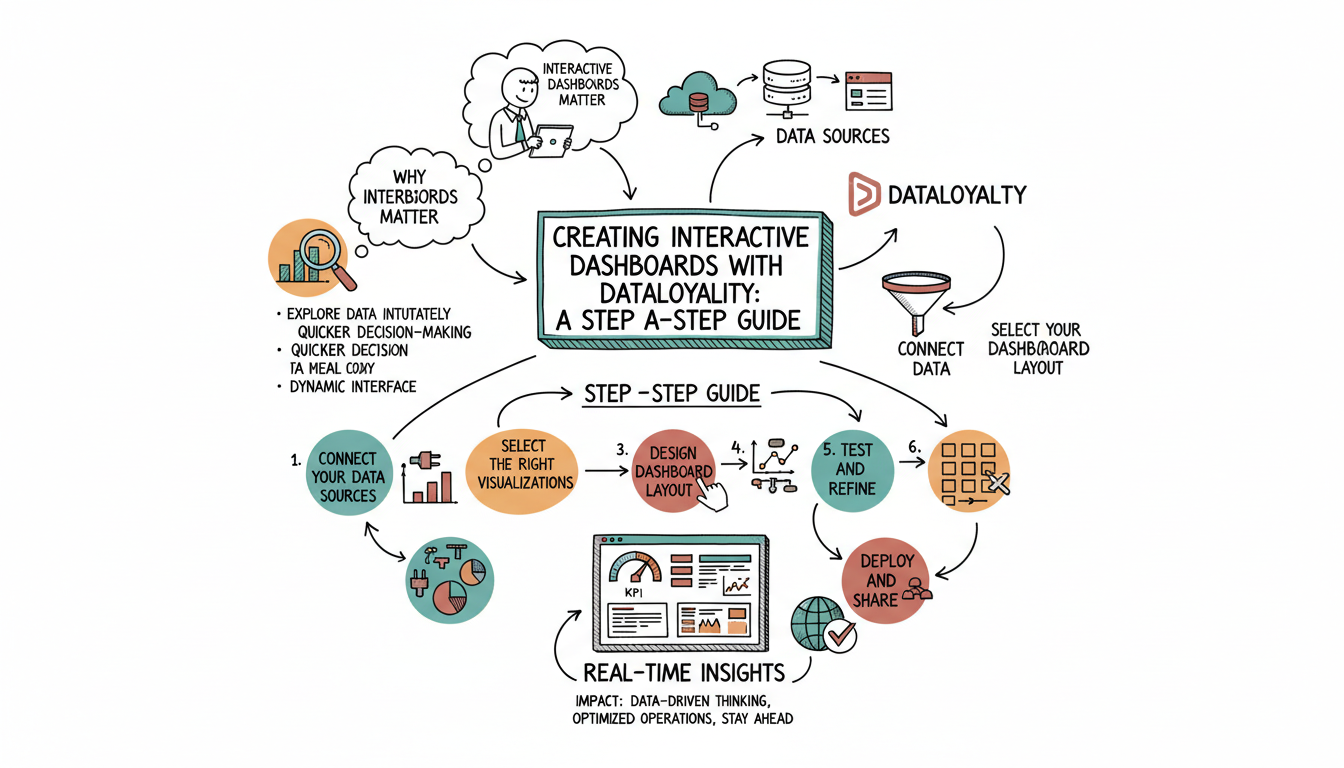
Interactive dashboards are essential for modern businesses because they allow users to explore data in a more intuitive and engaging way. Instead of static reports, interactive dashboards provide a dynamic interface where users can drill down into specific data points, filter information, and visualize trends over time. This interactivity not only enhances understanding but also enables quicker decision-making, which is vital in today's competitive landscape.
Getting Started with DataLoyalty
To begin creating interactive dashboards with DataLoyalty, it is important to understand the platform's capabilities and how it can be tailored to meet your organization's needs. DataLoyalty offers a user-friendly interface that simplifies the process of connecting to various data sources, whether they are cloud-based, on-premises, or a combination of both. This flexibility ensures that you can access all the relevant data needed to build comprehensive dashboards.
Step-by-Step Guide to Building Dashboards
Connect Your Data Sources: The first step in creating a dashboard is to connect DataLoyalty to your data sources. This could include databases, spreadsheets, or cloud services. DataLoyalty supports a wide range of integrations, making it easy to pull in data from multiple sources.
Select the Right Visualizations: Once your data is connected, the next step is to choose the appropriate visualizations. DataLoyalty offers a variety of chart types, including bar charts, line graphs, and pie charts, among others. Selecting the right visualization is crucial for effectively communicating the insights you want to highlight.
Design Your Dashboard Layout: Designing the layout of your dashboard involves arranging your visualizations in a way that is logical and easy to navigate. DataLoyalty provides drag-and-drop functionality, allowing you to customize the layout to suit your preferences and the needs of your audience.
Add Interactivity: To make your dashboard truly interactive, you can add filters, drill-down capabilities, and dynamic elements that allow users to explore the data in more depth. This interactivity is what sets apart a good dashboard from a great one, as it empowers users to find the answers they need quickly.
Test and Refine: Before deploying your dashboard, it's important to test it thoroughly to ensure it functions as expected. Gather feedback from potential users and make any necessary adjustments to improve usability and performance.
Deploy and Share: Once your dashboard is ready, you can deploy it to your team or organization. DataLoyalty offers various sharing options, including secure links and embedded dashboards, making it easy to distribute your insights to the right people.
The Impact of Interactive Dashboards
Interactive dashboards created with DataLoyalty can transform how organizations operate by providing real-time insights that drive informed decision-making. By enabling users to interact with data, these dashboards foster a culture of data-driven thinking and continuous improvement. As a result, businesses can respond more quickly to market changes, identify new opportunities, and optimize their operations for better outcomes.
In conclusion, creating interactive dashboards with DataLoyalty is a powerful way to harness the full potential of your data. By following this step-by-step guide, you can build dashboards that not only inform but also inspire action, helping your organization stay ahead in the ever-evolving business landscape.